|
Tool |
Description |
| Overview
Document |
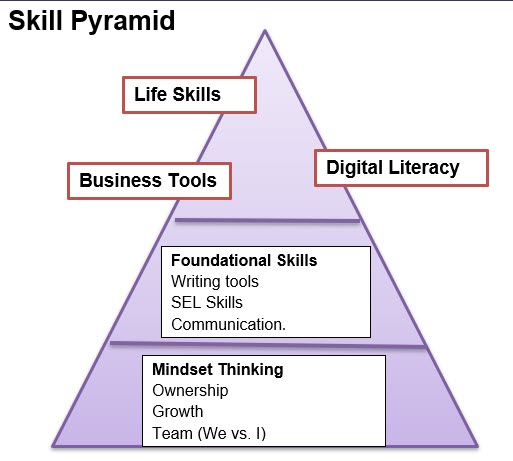
Key
Components, such as
Teamwork, Attitude, Communications, Social skills, Critical
thinking, Organizing & Planning, Professionalism
|
|
Info-Mapping |
Makes the document easier to read
with labels on the left side of the document and logical break up of
information in the document.
|
|
Mind-Mapping |
A mind map is a diagram used
to visually organize information. A mind map is hierarchical and
shows relationships among pieces of the whole. [1] It is often
created around a single concept, drawn as an image in the center of
a blank page, to which associated representations of ideas such as
images, words and parts of words are added. Major ideas are
connected directly to the central concept, and other ideas branch
out from those
|
| Time
Management |
Time management is the process of
organizing and planning how to divide your time between different
activities. Get it right, and you'll end up working smarter, not
harder, to get more done in less time – even when time is tight and
pressures are high. |
|
Goal Setting |
Goals- First consider what you want to
achieve, and then commit to it. Set SMART (specific,
measurable, attainable, relevant and time-bound) goals that motivate
you and write them down to make them feel tangible. Then plan the
steps you must take to realize your goal, and cross off each one as
you work it off |
| Process
Sheets |
Process planning is
a preparatory step before manufacturing, which determines the
sequence of operations or processes needed to produce a part
or an assembly. ... A route sheet is a document which lists
the exact sequence of operations needed to complete the job.
Process
Design
|
| Project
Management |
Project management
is the
discipline of initiating, planning, executing, controlling, and
closing the work of a team to achieve specific goals and meet
specific success criteria at the specified time. Wikipedia
Google Course in Project
Management |
| Flow Map |
A flowchart
is a type of diagram that represents a workflow or process. A
flowchart can also be defined as a diagrammatic representation of an
algorithm, a step-by-step approach to solving a task. The flowchart
shows the steps as boxes of various kinds, and their order by
connecting the boxes with arrows. Wikipedia
|
| Gantt
Chart |
A Gantt
chart is
a project management tool assisting in the planning and scheduling
of projects of all sizes, although they are particularly useful for
simplifying complex projects.
|
| Question
process |
The importance of
asking questions is our way of learning new things in life.
Use your
questions
to start the dialogue.
You can work together to create your thoughts
You need to write your thoughts as a group
Reflex
on your completion. What have we learned?, Need to know more
|
| Quality
Processing / ISO 9001 |
Customer-Driven Quality Deployment" is
a methodology that provides organizations a structured process and
tools to improve. Each element below helps make the improvements
possible. The whole organization, especially its leadership, must
articulate and believe in achieving both break thru and continuous
improvements
Kaizen- Continuous Improvement
|
| Balanced
Scorecard |
The Balanced Score card
breaks the measurement into 4 buckets that are at the core of the
business; Finances, Learning & Growth, Internal processes and the
Customer.
|
|
Closed-loop processing |
A closed loop control system is
a set of mechanical or electronic devices that automatically
regulates a process variable to a desired state or set point without
human interaction. Closed loop control systems contrast
with open loop control systems, which require manual
input.
|
| IOT-Internet
-of-things |
The Internet
of Things (IoT)
refers to a system of interrelated, internet-connected objects that
are able to collect and transfer data over a wireless network
without human intervention. The personal or business possibilities
are endless.
|
| 6-Sigma |
Motorola's method of managing
the amount of errors allowed in a quality process |
|
Math-graphing |
A basic two-dimensional graph consists of a
vertical and a horizontal line that intersects at a point called
origin.
The horizontal line is the x axis, the vertical line is the y axis.
In simple line graphs, the x and y axes are each divided into evenly
spaced subdivisions that are assigned to numerical values.
Chart a drawing depicting the relation between
certain sets of numbers or quantities by means of a series of dots,
lines, etc,
plotted with reference to a set of axes. |
|
Material-Flow JIT |
The just-in-time (JIT)
inventory system is a management strategy that aligns
raw-material orders from suppliers directly with production
schedules. Companies employ this inventory strategy to increase
efficiency and decrease waste by receiving goods only as they need
them for the production process, which reduces inventory costs. This
method requires producers to forecast demand accurately.
|
| Learning
Process |
Ownership of
your learning Learning promotes
starting with a question rather than looking for answers When
learning about a new subject as a team, we ask questions around
Looking for info about the subject.
Additional focus using questions
|
|
Personal Skills |
Trust, Respect, Independence, Collaboration, Kindness,
Listening, Empathy, Making things better, Curiosity, |
Mental Model thinking
https://fs.blog/mental-models/
The Best Way to Make Intelligent Decisions
|
In a famous speech in the 1990s, Charlie
Munger summed
up the approach to practical wisdom through understanding mental
models by saying: “Well, the first rule is that you can’t really
know anything if you just remember isolated facts and try and bang
’em back. If the facts don’t hang together on a latticework of
theory, you don’t have them in a usable form. You’ve got to have
models in your head. And you’ve got to array your experience both
vicarious and direct on this latticework of models. You may have
noticed students who just try to remember and pound back what is
remembered. Well, they fail in school and in life. You’ve got to
hang experience on a latticework of models in your head.” |